This is a two part workshop for UCLA DataFest competitors on how to organize a data analytics project with Python.
In Part 1 of this workshop series, Python’s BeautifulSoup and Tweepy libraries were utilized to collect data online for the analysis of Jeopardy contestant profiles.
Now that we have a complete dataset of contestants and their associated details, we can start our investigation!
Part 2: Contestant Analytics and Predicting Winners
Demographics & Characteristics
Let’s start with a general evaluation of the demographic data provided.
Contestants for Jeopardy are selected by taking an online quiz and meeting certain evaluation criteria. Contestants are eligible to come from the United States or Canada and are often widely dispersed across these countries.
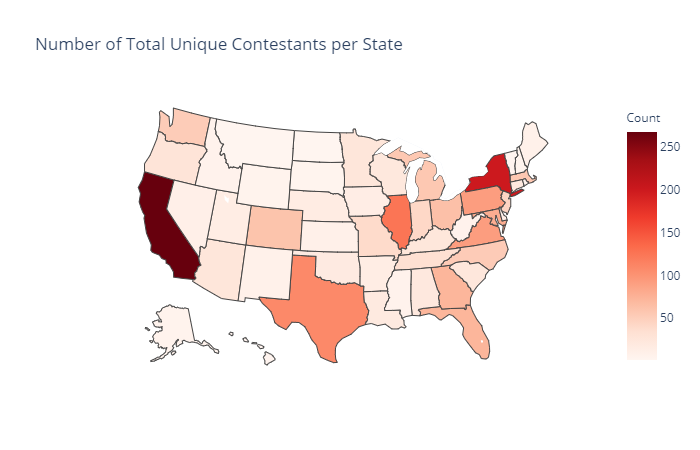
Contestants’ hometown state locations tend to correlate with population demographics, with many individuals coming from California (268), New York (200), and Illinois (125).
71% of contestants are unique to their hometown, demonstrating that individuals are not just selected from the large cities that can seem to dominate the selection process.
Occupations
A wide range of occupations are represented in our sample of Jeopardy contestants. Within our range of contestants, there are approximately 1,317 distinct careers held by individual contestants.
Doing the grunt work, we can go ahead and group each of these occupations into a ‘job category’. For instance, a ‘10th grade English teacher’ and ‘violin teacher’ are categorized as just ‘teacher’, and occupations such as ‘public health doctor’ and ‘emergency physician’ are grouped as simply ‘physician’. Doing so presents us with a count of 33 distinct job categories 1.
So which career paths appear most often on Jeopardy?
| Job Category | Number of Contestants |
|---|---|
| Unemployed | 196 |
| Teacher | 180 |
| Student | 145 |
| Manager | 138 |
| Lawyer | 135 |
| Writer / Author | 133 |
| Graduate Student | 98 |
| Artist / Designer | 62 |
| ... | ... |
We see that the most common jobs tend to follow three themes: free time, tournament categories, and writing/reading heavy roles. Individuals who are unemployed likely have the free time on their hands to study miscellaneous topics and build up their trivia skills, whereas those with full time jobs may not have such a luxury. Jeopardy’s most common tournaments consist of ‘Teen’, ‘College’, and ‘Teacher’ categories that fuel the high number of these roles we see in the data. What is of interest is those job categories outside of the standard tournaments. These non-tournament categories are often those with reading/ research heavy roles (Lawyers/ Graduate Students) and those with creative work that may lead to a wide range of educational and different fields of work (Writers/ Artists).
We can also review the least common job categories:
| Job Category | Number of Contestants |
|---|---|
| ... | ... |
| Salesperson | 18 |
| Coordinator | 17 |
| Musician | 17 |
| Military / Clergy | 16 |
| Laborer | 13 |
| Marketing | 11 |
At first glance, nothing seems too special about these job categories. ‘Musician’ seems somewhat surprising given the number of music related subject matter seen in Jeopardy questions. Of significant note is the general lack of jobs that tend to involve physical labor requirements (Military/ Laborer). Jeopardy has always tended to be one of the most pronounced “white collar” focused game shows on television, and the data seems to support that argument.
So, of a given job category, which tends to produce the most winners 2?
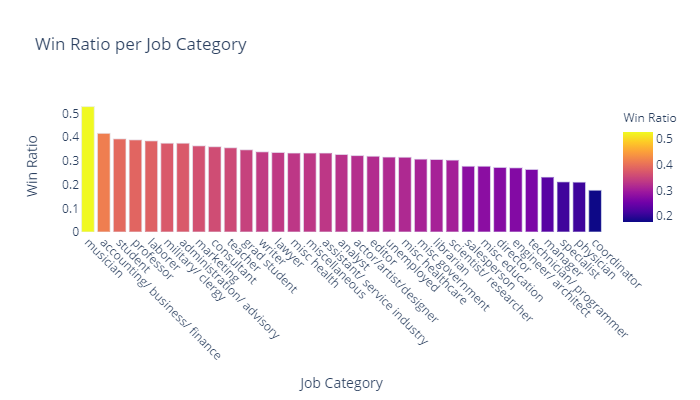
Overall, little to no pattern emerges in the categories as to which seems to have a likelihood for winning more often than not. None of the job categories have higher than a 50% ratio of winners. However, several of our under-represented job categories do feature a higher-than-average proportion of winners!
Gender
An additional element we can extract from the data (even if just algorithmically) is the gender of our contestants. The ‘gender_guesser’ package can be used to discern the gender based on the name of each contestant. Doing a bit of grouping and manual review, we get the following counts:
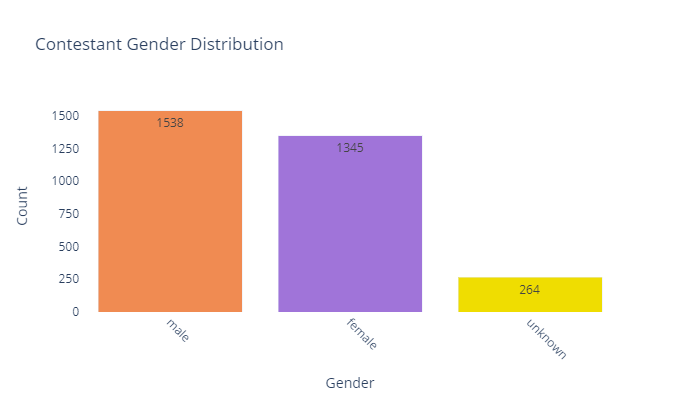
The parity of gender seems roughly equal, with males being more prominent then females by ~14%. The number of winners also appears to parallel the gender counts, with a difference of 317 male winners versus 260 female winners.
Personal Anecdotes
Pulling in the Twitter dataset allows us to perform sentiment analysis on each individual’s ‘fun fact’ summaries and attempt to capture some inference on their personality. These being summarizations from a single Twitter user makes this data a bit corrupted, but fun and worthwhile analyzing regardless.
Using the ‘textblob’ NLP package, we can capture the polarity and subjectivity of each fun fact 3. Contestants on average have a positive polarity score of 0.41 which indicates that most of the fun facts shared seem to be full of fun and interesting content. We also see most of these tweets are being recorded with a subjectivity score of 0.15, indicating they are objective in their format and content.
For fun, we can also generate our own fun facts using the ‘textgenrnn’ package, which utilizes recurrent neural networks to generate text 4. Some of my legitimate fun facts used in the program are just as absurd as the ones generated, such as:
- “In Mexico, I was mistaken for Nicolas Cage.”
- “I snuck my friend out of the hospital disguised as an EMT.”
- “My bride and I wore giant inflatable T. Rex costumes.”
Compared to the ones generated with textgenrnn:
- “I love blood with my name in a sun.”
- “I was a boat for a powerlifter.”
- “I was a college bartender.”
Pretty neat!
Winnings & Winners
Contestants typically play an average of 1.6 games. Roughly 72% of all contestants will only ever play a single game, with 98% of contestants playing 5 games or less. Any player who gets above this 5-game threshold is a bit of an outlier, having carved out a significant amount of cash winnings for oneself.
The median end score needed to win and move on in any given game of a Jeopardy tournament is $18,800. To come in second place still requires that you win a hefty average sum of $10,399 5.
Due to these statistics, it is typically seen that a strong player with a solid strategy and wit can keep dominating the board and win multiple games in a row. For example, Julia Collins won 20 consecutive victories between April 21 and May 30 of 2014.
While reviewing winners, it’s worth evaluating the proportion of winners produced from each state. Thinking back to the original number of contestants per state, we can take the proportion of winners out of the overall count of contestants from their home state to produce the following heatmap:
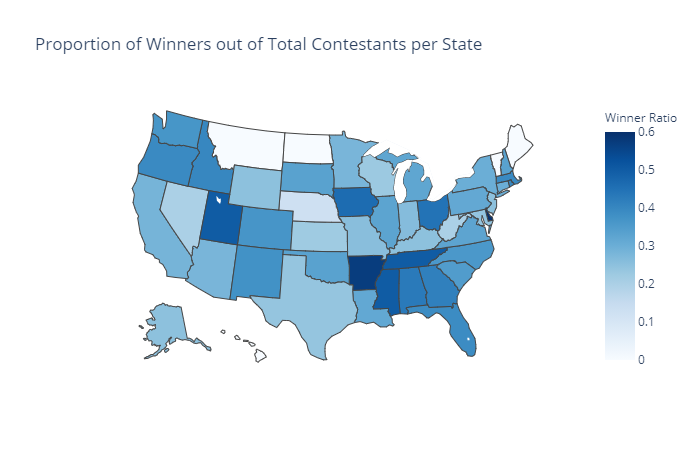
Unsurprisingly, states with few overall contestants tend to have a higher proportion of winners from their home state, such as Arkansas and Delaware. The South in general seems to produce a high number of winners proportionally, whereas states such as California and New York get washed out in this ranking.
Putting it all together: can you make a winner?
But is it possible to predict who will win based on just a contestant’s demographic data (e.g. hometown, gender, job category, and personal anecdote sentiment)? This is a challenging question that requires defining. Are we predicting if an individual candidate will win, or predicting their total amount of winnings they earn before being set into their final rank 6?
For the purpose of this analysis and the data available, we will address the former question. We can create a unique database of contestants and build a binary flag of whether or not they have won at least one game of Jeopardy. In this case, ‘1’ would indicate the contestant has won at least one game, and ‘0’ would indicate the contestant has won no games. This helps address outliers like the infamous James Holzhauer who has played in 30+ games, and boil him down to a single snapshot.
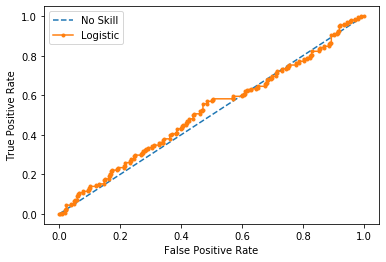
Evaluating these criteria in the form of a logistic regression model, we find next to no correlation between the variables (Pseudo R-Squared -0.005). In fact, when attempting to predict results with several different models, we find next to everyone in the test dataset being labeled as a non-winner! Our model produces a test dataset accuracy of 68%, a misleading statistic given that two-thirds of the data are non-winners from the get-go. This can be reviewed with an ROC curve, seen below. Our model is only slightly better than picking winners at random.
Final thoughts
So, what does this mean? Has all this work been for nothing? Quite the contrary. Sometimes life, especially game show results, aren’t predictable! Whether it’s a lack of detailed data, a mis-defined inference, or a challenging problem to solve, sometimes we can’t find the results we hoped for.
Or are we? Instead, I would argue our investigation has shown that anyone can make it onto Jeopardy and be a successful contestant. Regardless of an individual’s hometown, job, gender, or the funny quip they describe on the show, what matters is the strategy and effort contestants take to study and prepare for these trivia shows. In a paraphrase to my favorite Disney film Ratatouille’s famous quote: “Anyone can win on Jeopardy!”.
When competing in DataFest, remember, it’s not the results themselves that matter, but the story you tell with them!
Footnotes + Citations
-
Individuals listed as “retired”, “originally X”, or listed as a unique ‘age’ are listed as “unemployed”. ↩
-
When evaluating the winner ratios for job categories, “Student” / “Teacher” / “Unemployed” should be regarded separately given that these individuals have their own tournaments. Those indicated as “Professor” are NOT featured in Teacher’s tournaments and therefore do not need to be considered in this way. ↩
-
Polarity is a float that lies between [-1,1], -1 indicates negative sentiment and +1 indicates positive sentiments. Subjectivity is also a float which lies in the range of [0,1]. Subjective sentences generally refer to personal opinion, emotion, or judgment. ↩
-
A more detailed walkthrough into the neural networks used to operate textgenrnn can be read here: https://karpathy.github.io/2015/05/21/rnn-effectiveness/ ↩
-
When calculating total scores, we are calculating the gross final scores that players earned in their game play. However, most contestants will not see these totals in their winnings, as most tournaments settle to give second place $2,000 and third place $1,000, regardless of what they earned in game. ↩
-
In Jeopardy, only first place takes home their overall winnings. Second place receives $2,000 and Third place receives $1,000. ↩