A deep dive into how students get ticketed in Westwood.
Picture this: you’re a UCLA student walking home on a bright, sunny SoCal day. Life is great.
That is, until you find that dreaded slip on your car’s front dash: a parking ticket.
For many students with cars, parking is a daily hassle on the residential side of Westwood. With rising rates of congestion 1 and a lack of infrastructure to handle more car owners, the competition increases for students to fit cars wherever possible. I myself, along with many other drivers in Westwood, have been face to face with a ticket at some point or another. This lead me to the question: how are Westwood residents getting ticketed, and are there possible ways to minimize such tickets?
Utilizing Los Angeles’s Open Data Initiative 2, started by Mayor Eric Garceti in 2013, we can collect every parking ticket handed out in the City of Los Angeles since the beginning of 2015. The raw data set contains upwards of nine million parking tickets total. Using the data’s longitude and latitude variables, we can subset our data to just the village of Westwood.
From January 1st, 2015 to September 9th, 2019, there have been over 61,000 tickets written for over fifty different type of parking violations in Westwood’s local area. The raw data set is quite messy, and needs some further investigation.
For instance; several of the violation descriptions and street names are mismatched, and need to be corrected and aggregated.
| Violation Description | Street Address |
|---|---|
| DISABLED PARKING/NO DP ID | 515 S LAND FAIR AVE |
| DISABLED PARKING/ OBSTRUCT ACCESS | 515 LANDFAIR AVENUE |
| DISABLED PARKING/BOUNDARIES | 515 LANDFAIR |
The overall trend in ticketed violations has been on the rise, despite a drop in ticketing in 2019. From the start of 2015 through most of 2018, there was a rise in ticketing by a little over 9%. Westwood is already one of the most ticketed neighborhoods in all of Los Angeles 3.
Where are tickets given?
Of the 50 to 70 different categories of parking violations (depending on how you categorize them) the top 10 violation categories account for 95% of the total tickets given. We will focus on the top 6 categories, which still account for 86% of parking ticket violations alone, and hold at least 3% of the total share of tickets.
| Violation Category | Count of Violations | Percent of Total |
|---|---|---|
| NO PARK/STREET CLEAN | 24,529 | 40.20 |
| PARKED OVER TIME LIMIT | 15,645 | 25.60 |
| DISPLAY OF PLATES/ TABS | 4,607 | 7.55 |
| METER EXPIRED | 2,624 | 4.36 |
| RED ZONE | 2,624 | 4.30 |
| PARKED ON SIDEWALK | 2,170 | 3.56 |
The majority of parking tickets, just over 40%, are due to street cleaning violations. We can get even more granular and see which violations are most common per street in Westwood.
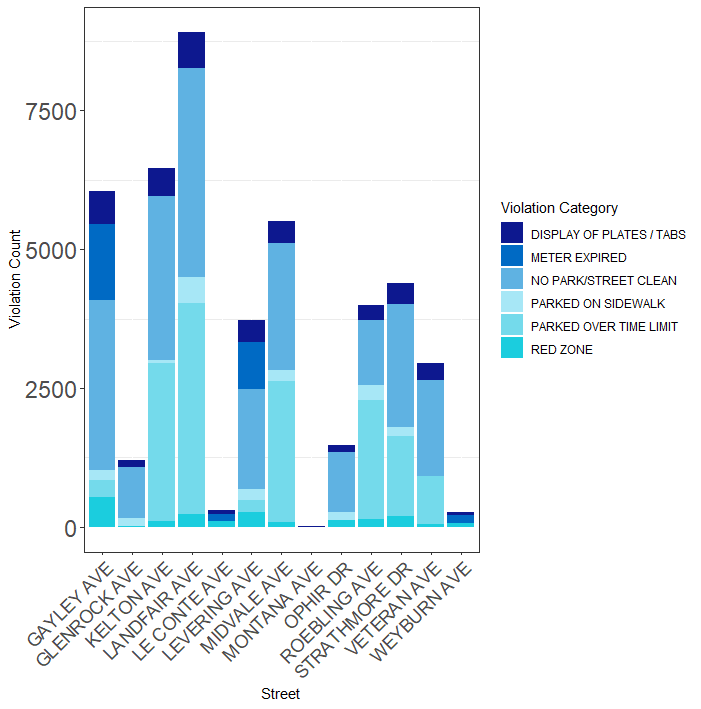
The dreaded Landfair Avenue still holds the title of being the worst street in Westwood, namely due to its rough roads, tandem parking, and top count of parking violations. Le Conte Ave and Montana Ave have much stricter parking requirements then other streets, resulting in far fewer parking violations. Gayley and Levering both have meters on portions of their streets that inflict their fair amount of tickets. All streets suffer at some point from street cleaning violations, as well as cars parked over the time limit.
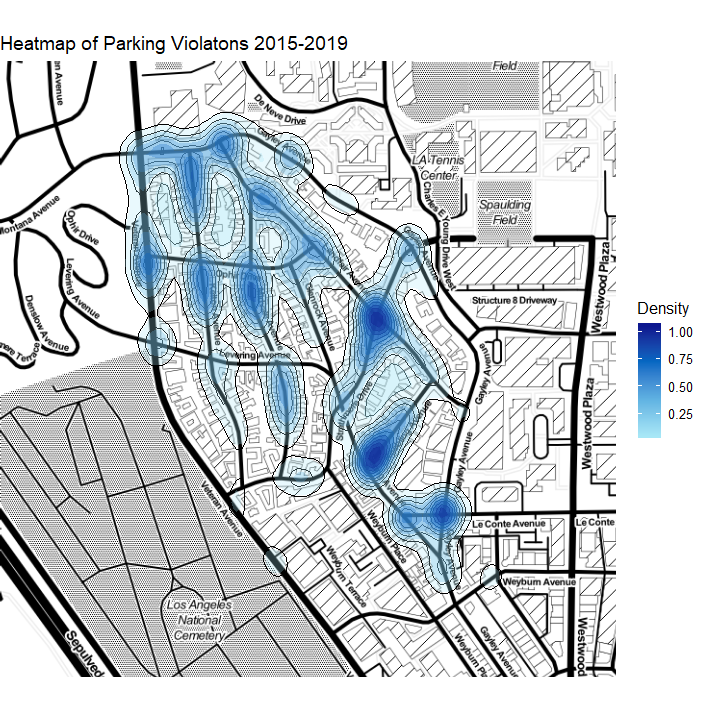
We can create a heatmap of the tickets given to create a better visual of where hotspots for ticketing occurs:
# Generating the Heat Map in GGPlot2
cols <- c("#a7e7f6","#5fb2e2","#006ac4","#0d188f")
heatmap <- westwood_map +
  geom_density2d(data = WWParking, aes(x = longitude,
    y = latitude, color=..level..)) +
  stat_density2d(data = WWParking, aes(x = longitude, y = latitude,
    fill = (log10(stat(level))-4), alpha = (stat(level))),
                 size = 0.01, bins = 10, geom = 'polygon') +
  scale_color_gradient(low = "black", high = "black") +
  scale_fill_gradientn(colours = cols) +
  scale_alpha(range = c(0.25, 0.5), guide = FALSE) +
  labs(fill = "Density") +
  guides(alpha = F, color = F) +
  theme(#legend.position = "none",
    axis.title = element_blank(),
    axis.text.x = element_blank(),
    axis.text.y = element_blank(),
    text = element_text(size = 12)) +
  labs(title = "Heatmap of Parking Violatons 2015-2019")
Overall, a high density of violations seems to occur on street corners, likely due to how the tickets are geo-encoded. Gayley, Landfair, Roebling, and Midvale are all high density areas for ticketing, regardless of the category of ticket being handed out.
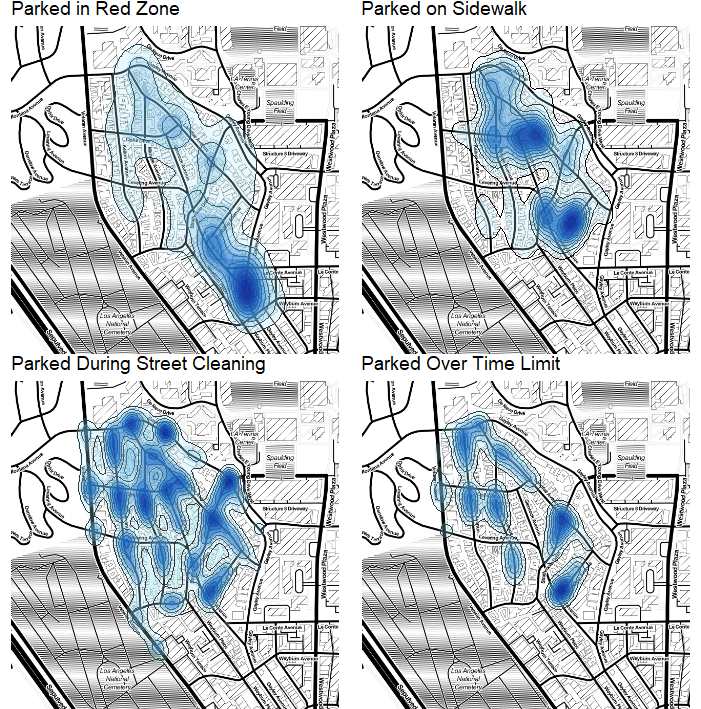
Subsetting for different types of violations lets us get a more granular look:
Reviewing each category:
-
Red Zone. This happens all throughout Westwood, BUT the red zones around the local Chevron station are a hot spot for getting caught. Even if you think you have time to run in for a quick slushie or bag of chips, think twice about parking in the red.
-
Parked on the Sidewalk. This is a big one for me, as I have gotten this ticket TWICE. If you have tandem parking you know the struggle of making sure to not park onto the curb.If you are ever in doubt if you are in the “parkway apron” or not, just make the move and save yourself a few bucks.
-
Parked during Street Cleaning. Read the sign and avoid the fine. No matter where you live (even parts of Veteran!) you are in danger of the street clean.
-
Parked over Time Limit. A more obvious one relative to restrictions on how long you can park in certain zones (e.g. zipcar spots, 2 hours park zones, etc.) Roebling and Strathmore are dangerous for this one.
What street you live on makes a huge difference for how significant ticketing will affect you, as well as what types of tickets will end up bothering you.
When are tickets given?
Now lets look at the time that violations happen. First, we notice right away that Thursdays and Fridays are when a majority of tickets are given out. Almost 58% of parking tickets occur on Thursday and Friday. In Westwood, all street cleaning happens on these two days of the week.
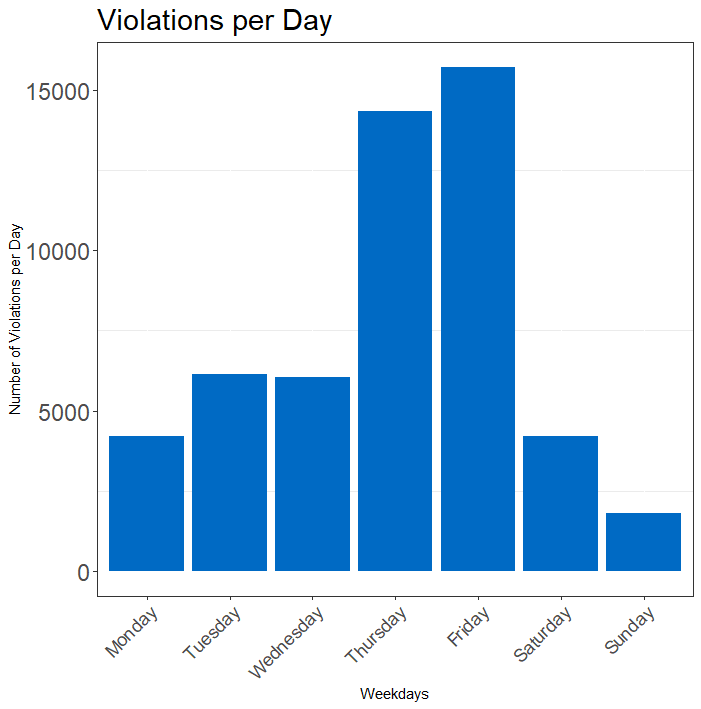
Additionally, we see that Sundays have the least violations. This is likely due to many streets normally having two hour parking limits, which are waived on Sundays.
It becomes even more apparent that street cleaning is the main source of ticketing when we look at the time of day tickets are being given. A staggering amount of tickets are given bright and early at 8 AM, an uncomfortable time of day for many sleep deprived UCLA students.
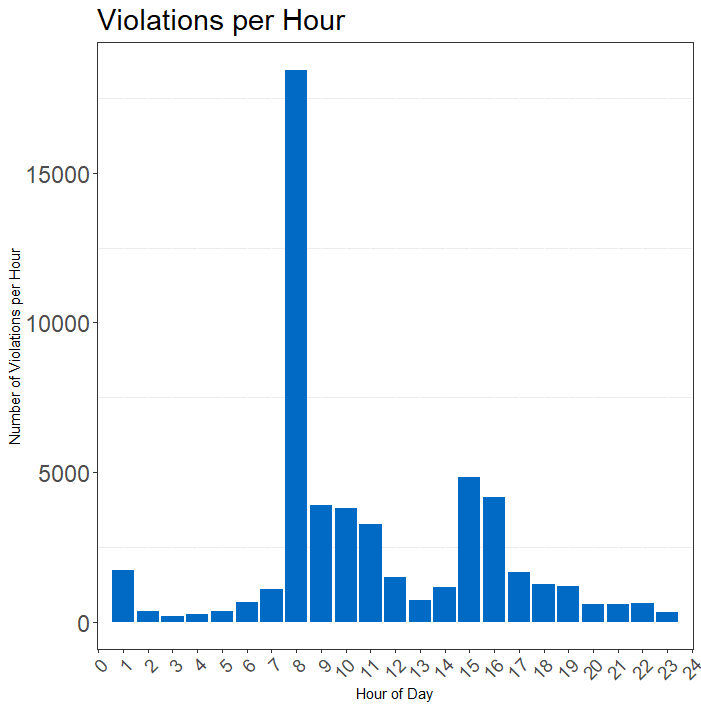
Street cleaning continues until 10 AM for Westwood streets. So why is there no drop-in violations until 12ish? A second round of ticketing starts up at 10 AM for parking over the time limit, which is 2 hours every day (except Sunday) from 8 AM to 6 PM. After seeing every car at 8 AM, street patrols will come back around and mark up any car still left on the street from that previous time. From 3-5 PM, the resulting spike comes once again from another round of time limit violations.
Avoiding the Street Cleaning Ticket
Instead of idiling in your car from 8am to 11am once a week, wouldn’t it be great if you could move your car back before the designated time? Lets look at when every street cleaning ticket was given, and determine when you do and don’t have to move your car.
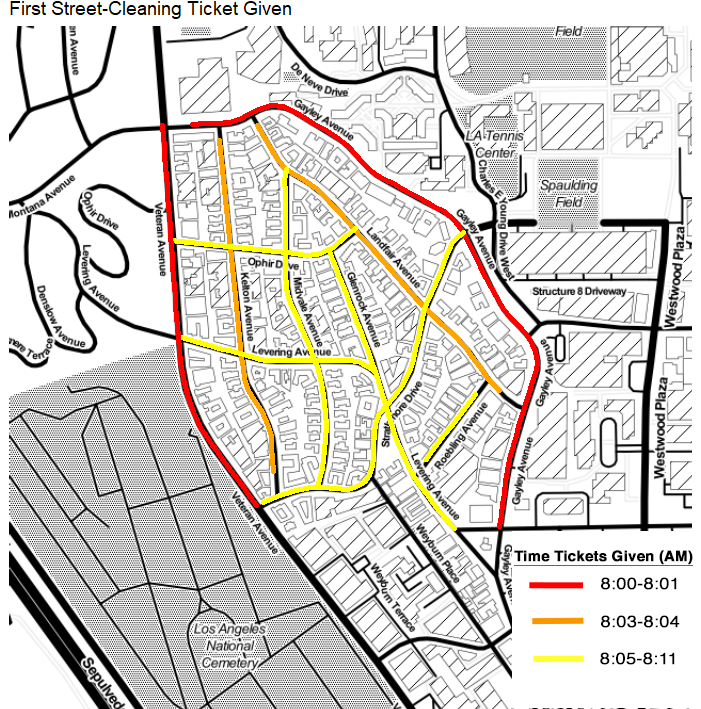
The first tickets given 4 consistently make the 8AM mark, with parking enforcement officers getting to their designated spots right on time for their daily bounty. This leaves little wriggle room for error when moving your car in the morning. It is interesting to note that the tickets seem to work their way into Westwood, from Gayley and Veteran slowly inwards toward Glenrock, where you have a few additional minutes after 8 to get to your car.
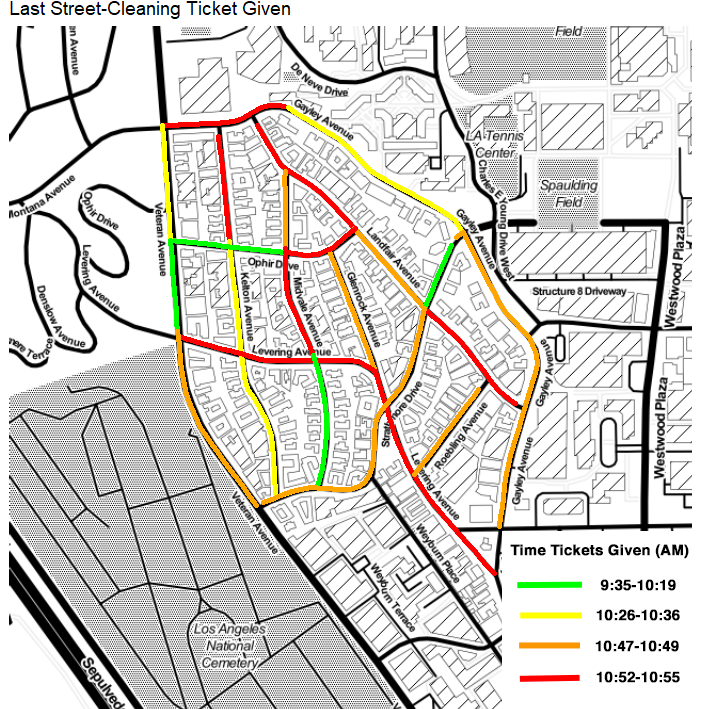
The last tickets given 5 are significantly different by street. Not only are they all over the place, their range given can vary widely by the day. Variations can be attributed to how many spots are available on a particular street in the first place, as well as the route chosen by the parking violation officers in the morning. While its safe to say that some spots open up as early as 10:20, the bulk of last tickets are given out until closer to 11 at roughly 10:50, when some officers might be gracious enough to look the other way.
But what if you have a tolerance for risk? Would you take a 1% chance at a ticket?
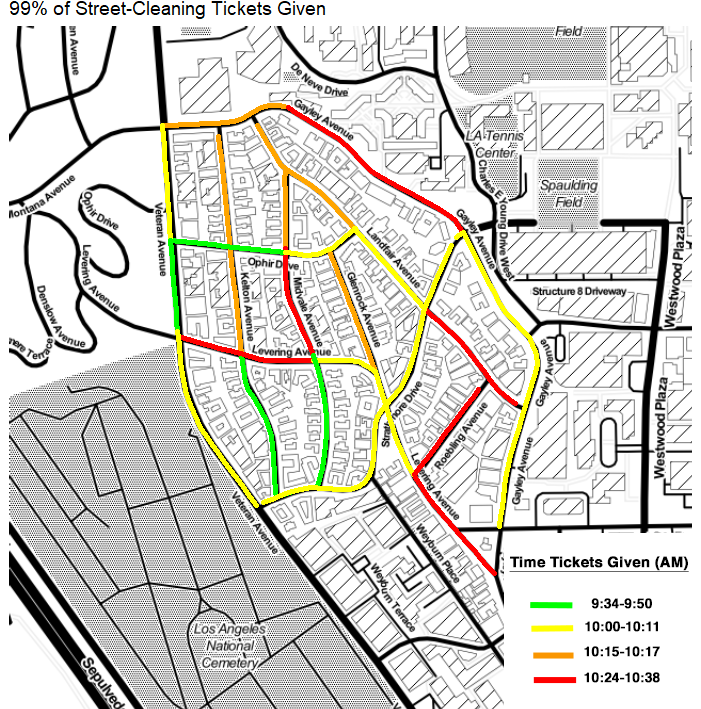
This last graphic illustrates when 99% of tickets have been given out on a particular
street. Most of Strathmore and Landfair have their last tickets given by 10:17,
and the bottom of Kelton and Midvale open up again before 10:00!
If you are running late to your class at 11, hopefully you can refer to this to shift the parking odds into your favor.
How much money does Los Angeles make from Westwood tickets?
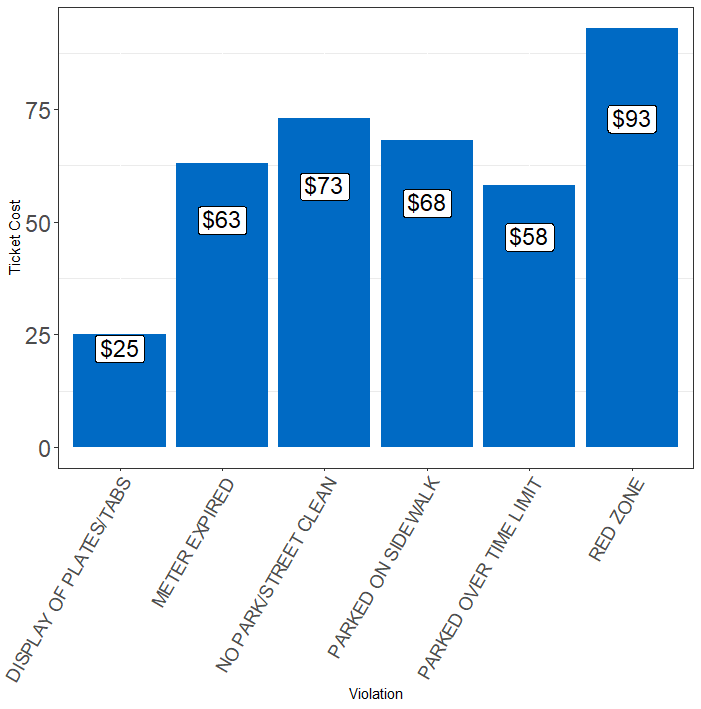
Ticket prices have continued to climb over the years. At present, five of the six violations we have discussed cost over $58 per violation. Given the already rising tuition, rent, and general fees associated with being a UCLA student, getting an additional fee can put someone over the financial edge.
From 2015 to the through August 2019, $4,280,750 in revenue has been made from the Westwood area in tickets. This is a staggering amount of money to be taken from the Westwood general area, largely due to the poor infrastructure currently available for the growing UCLA community.
This isn’t to say that parking fines are inherently evil. Ticketing serve a public good, and is important for policing our neighborhood streets. But if your street has already been cleaned, there is no point idling in your car waiting for 10 AM to roll around. It only serves to add more traffic and pollution that can be fixed with informed decision making. Hopefully, this information can help car owners in reducing the chaos and problems associated with parking in the hills of Westwood.
Data
Code
Footnotes + Citations
-
Mapping the Most Parking-Ticketed Blocks in All of Los Angeles ↩
-
First 1% of Tickets given on particular street. ↩
-
Last 1% of Tickets given on particular street. ↩